This page is a run-of-show for demos, not end-user documentation. Each section
pairs the spoken script with a placeholder for the screenshot that goes with
it — replace the placeholder with an actual image once it’s captured.
1. Logging In
To get started with EARNIE, you have two ways to log in: standard email and password, or SSO for enterprise environments.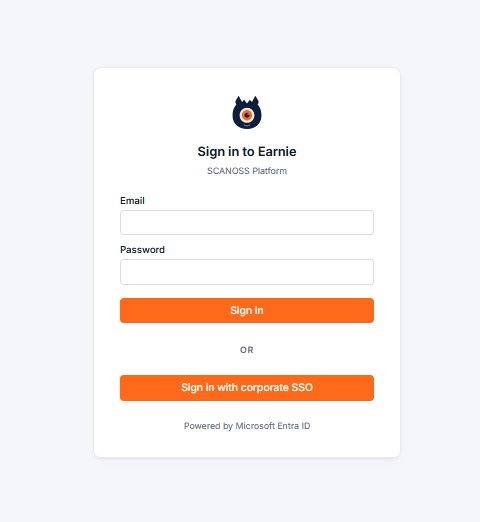
2. Onboarding & Setup
As you go through the EARNIE onboarding, you’ll get a quick overview of its key capabilities. For this demo, we’ll connect EARNIE to a GitHub repository. By the time EARNIE launches, we’ll support all major Git providers. EARNIE is also designed to fit different deployment requirements, with SaaS, on-premises, and self-hosted options available.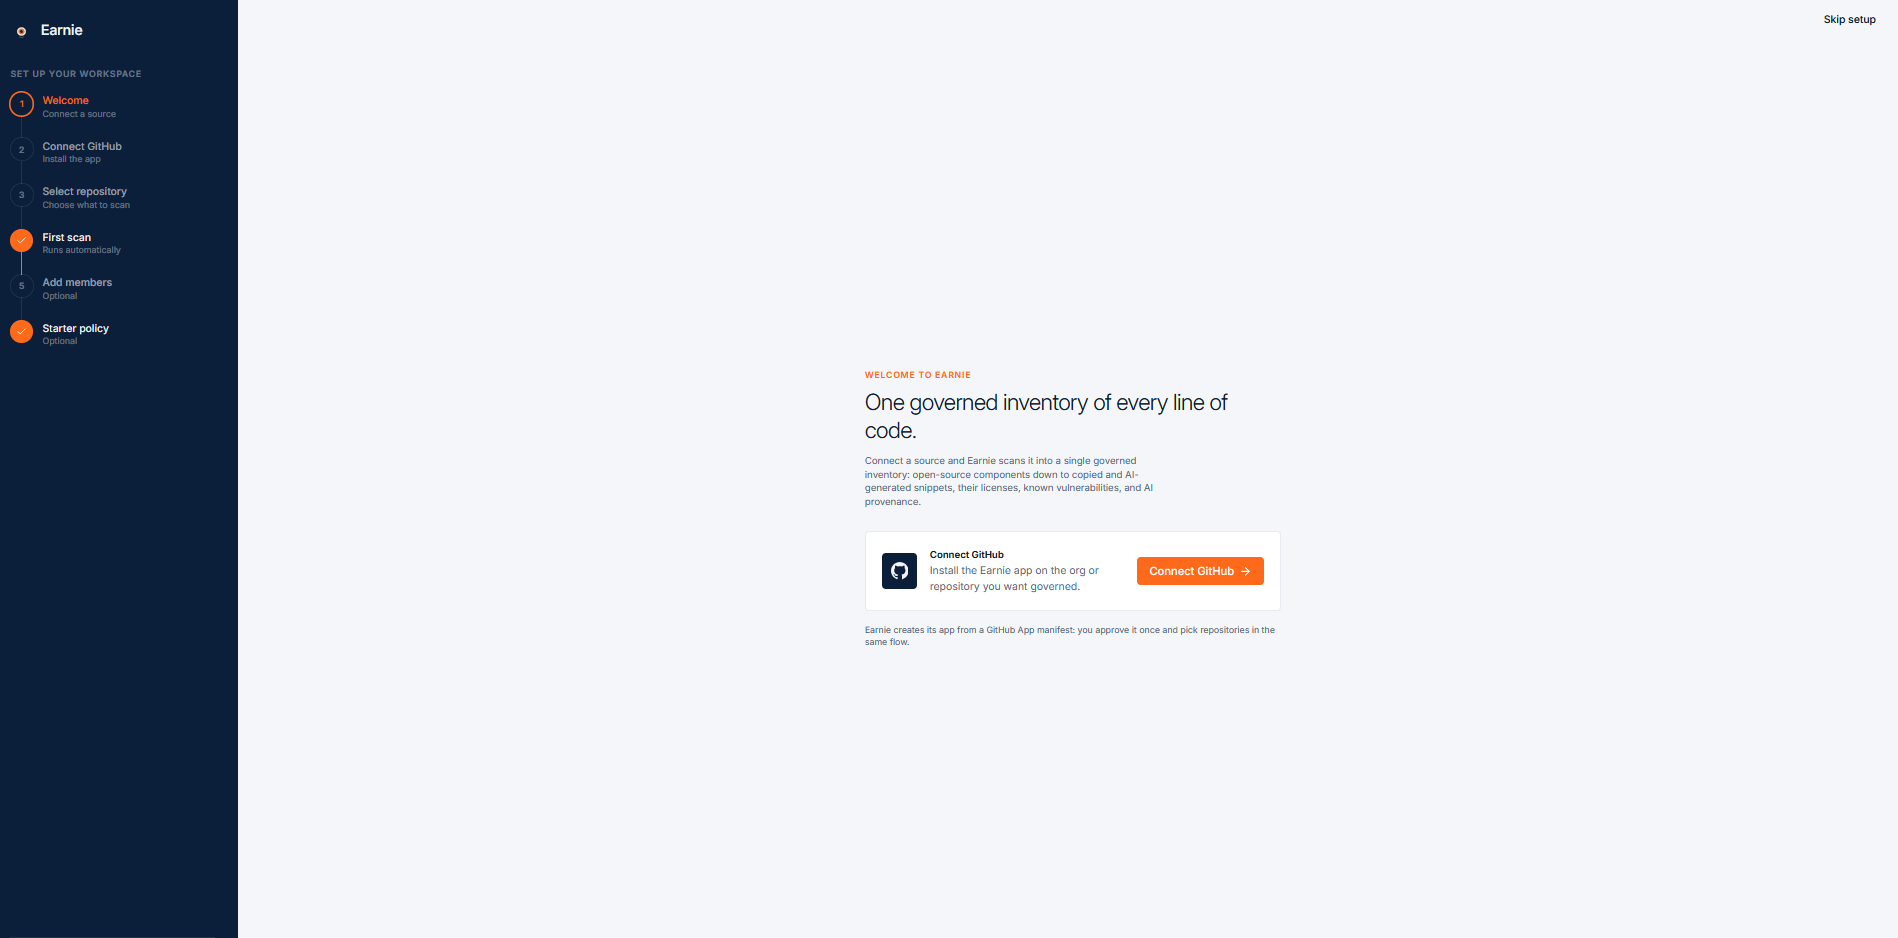
3. Inviting Your Team
EARNIE is designed for collaboration. You can invite people to your workspace and assign roles with specific permissions, giving teams the right level of access across the platform.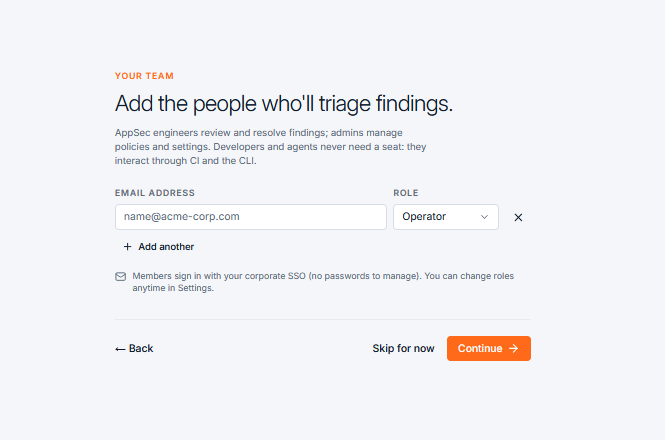
4. Choosing Policies
The final step is to choose your policies. EARNIE provides a range of pre-built policy templates to help you get started, which you can then customise to fit your organisation’s requirements.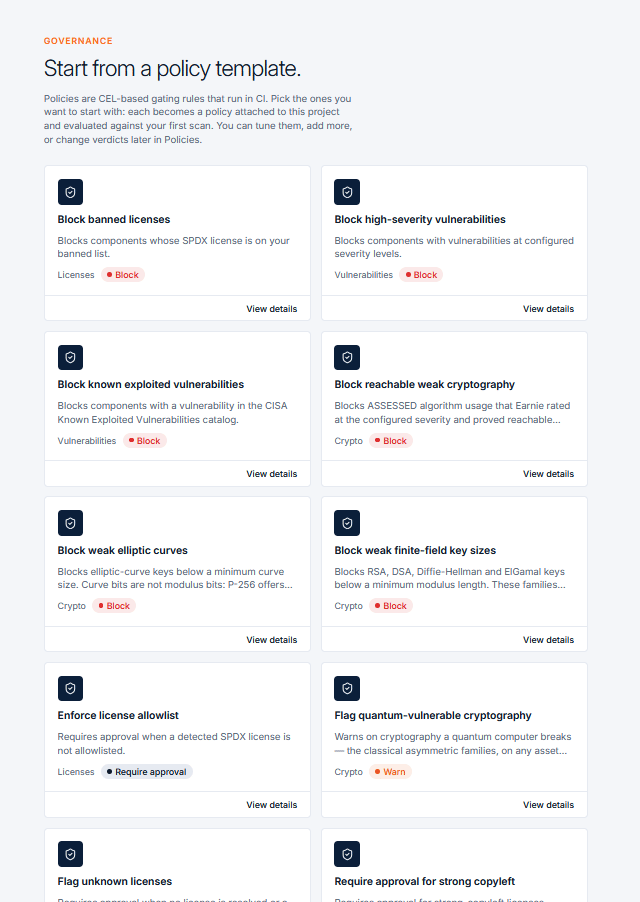
5. Scan History
Once the scan is complete, you’ll be taken to the Scan History page, where all relevant findings are displayed.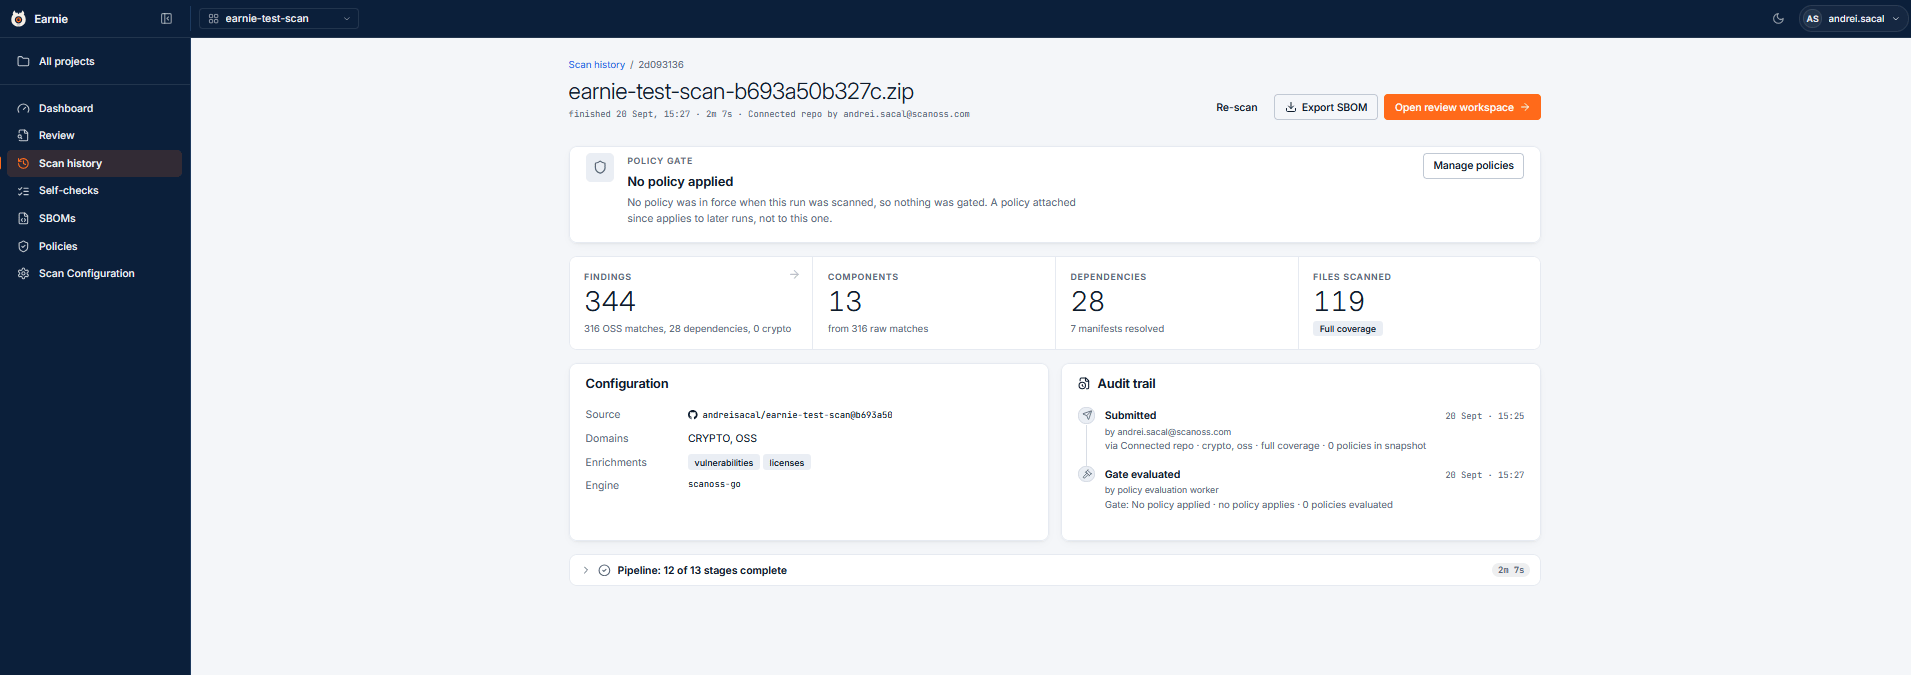
6. Review Workspace
On the left, you can explore findings by file, either through a folder tree or grouped by component.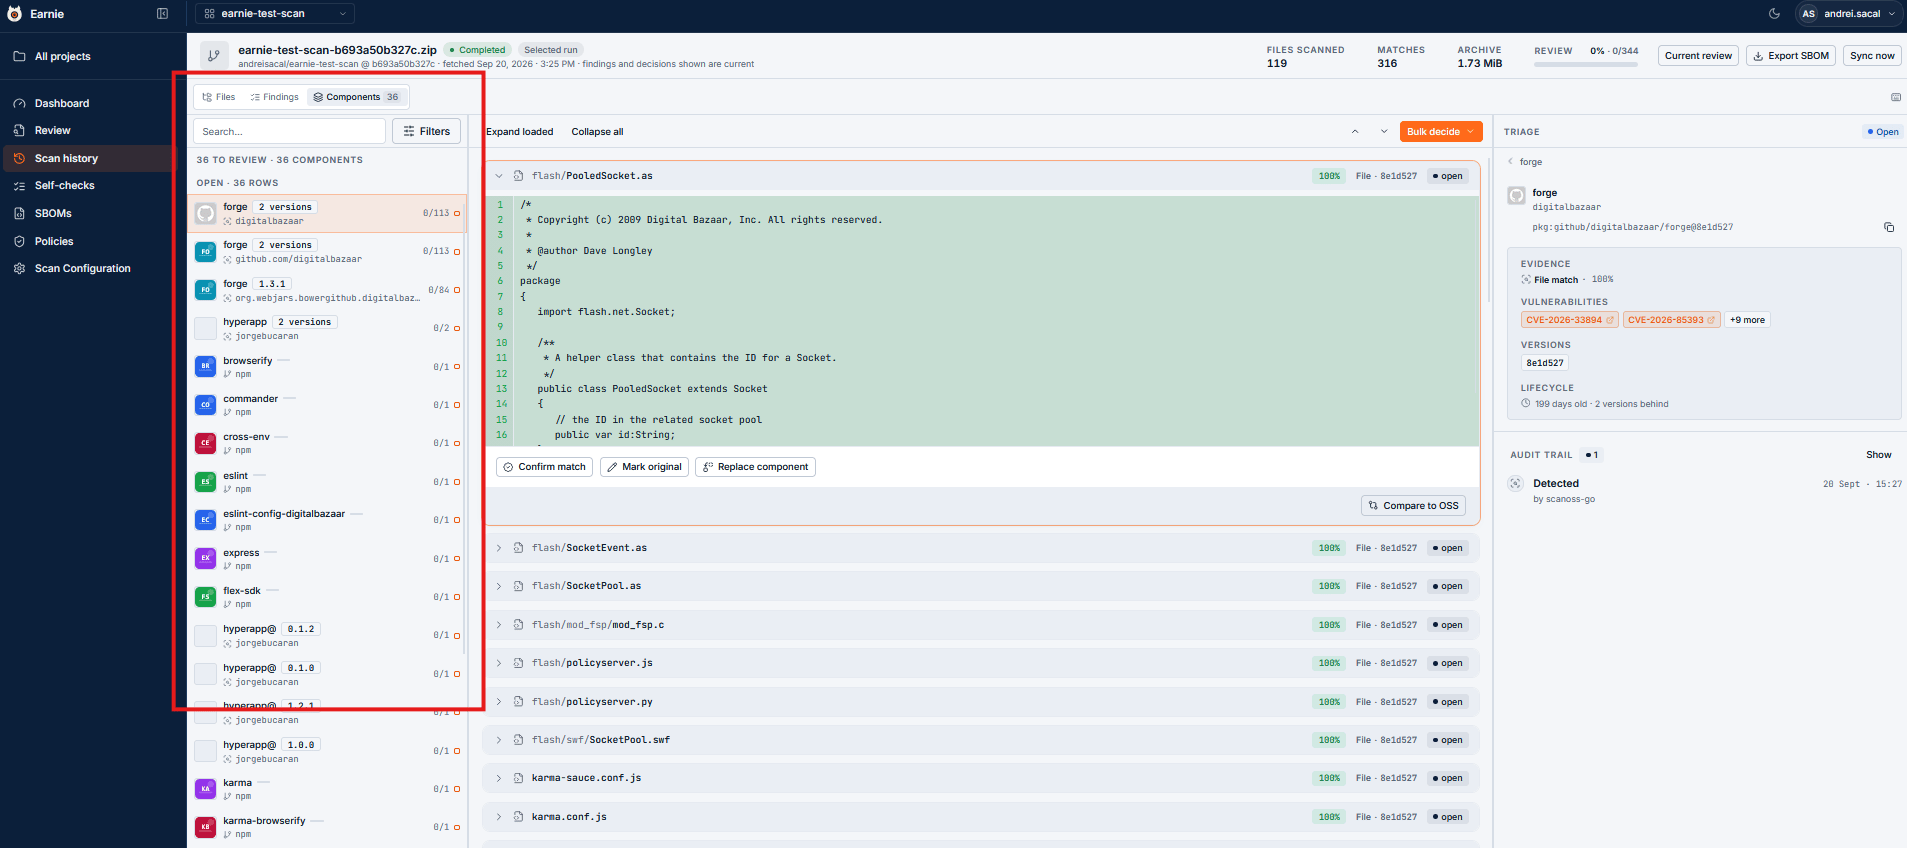
7. Investigating a Finding
In the centre, you have several options to investigate each finding. You can see the filename, wrap the code for easier readability, and compare your code directly against the matched open source component. You also have a dropdown showing all the open source components matched to that file.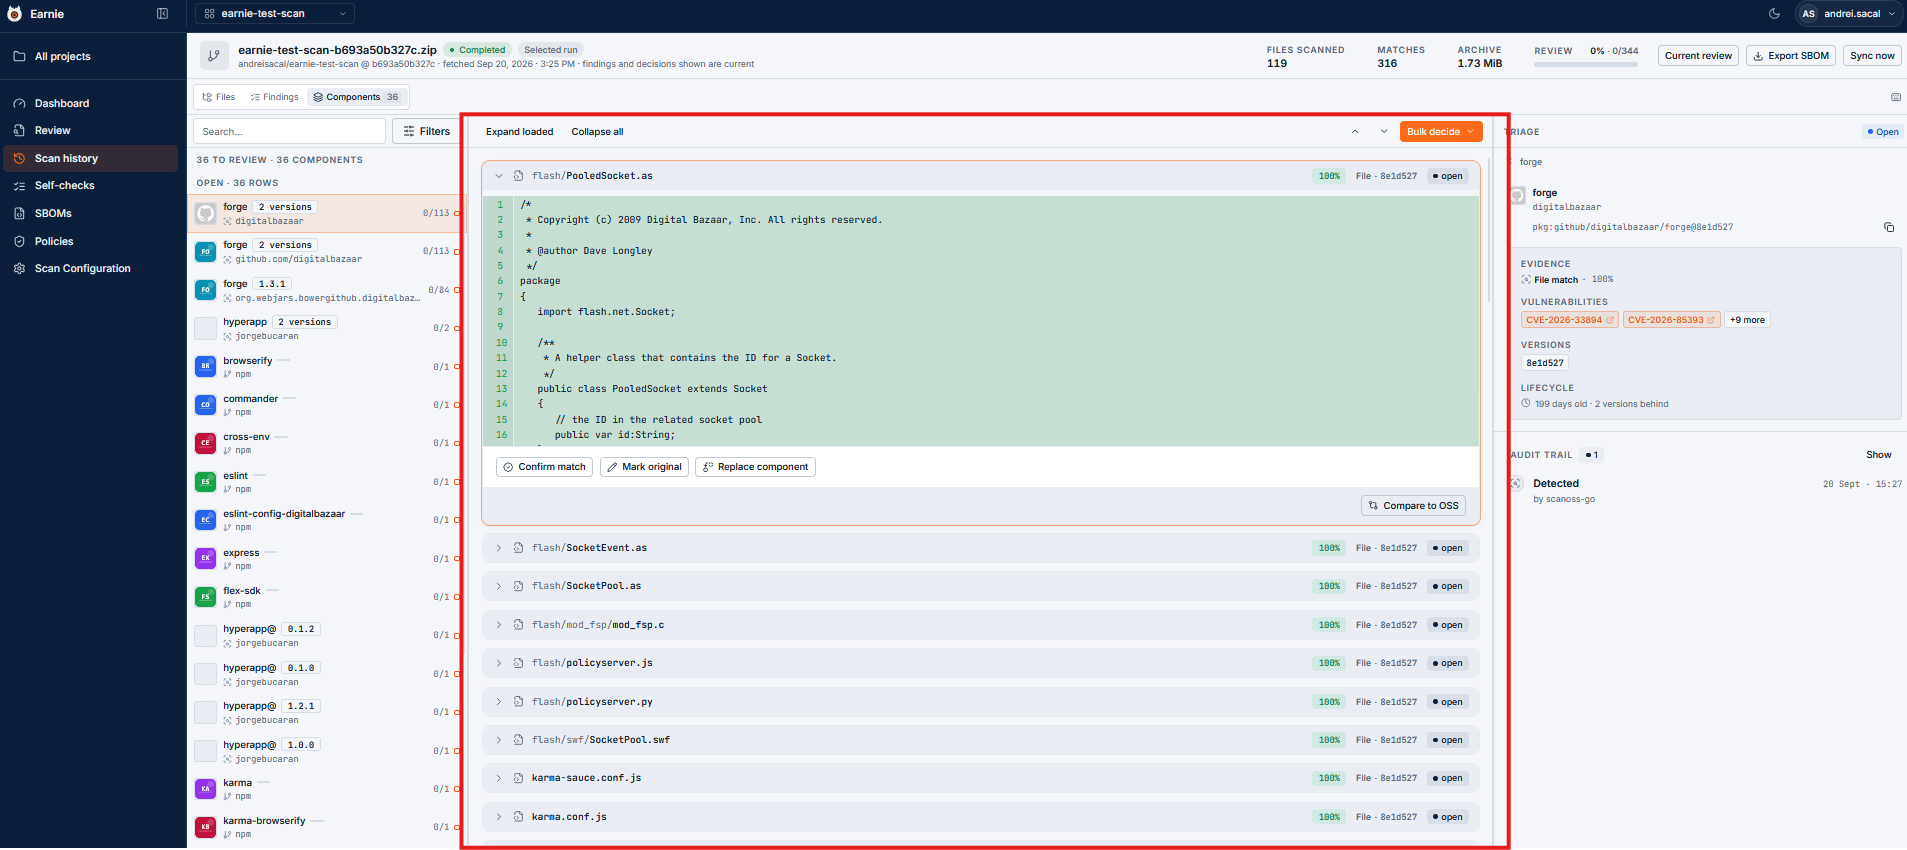
7. Finding Metadata
For each component, the panel on the right shows the relevant metadata. This includes the evidence type, such as a snippet or full-file match, the relevant version and lifecycle status, and which policies the component is flagged against. You can also see the audit trail, giving you a clear history of the actions taken on that finding.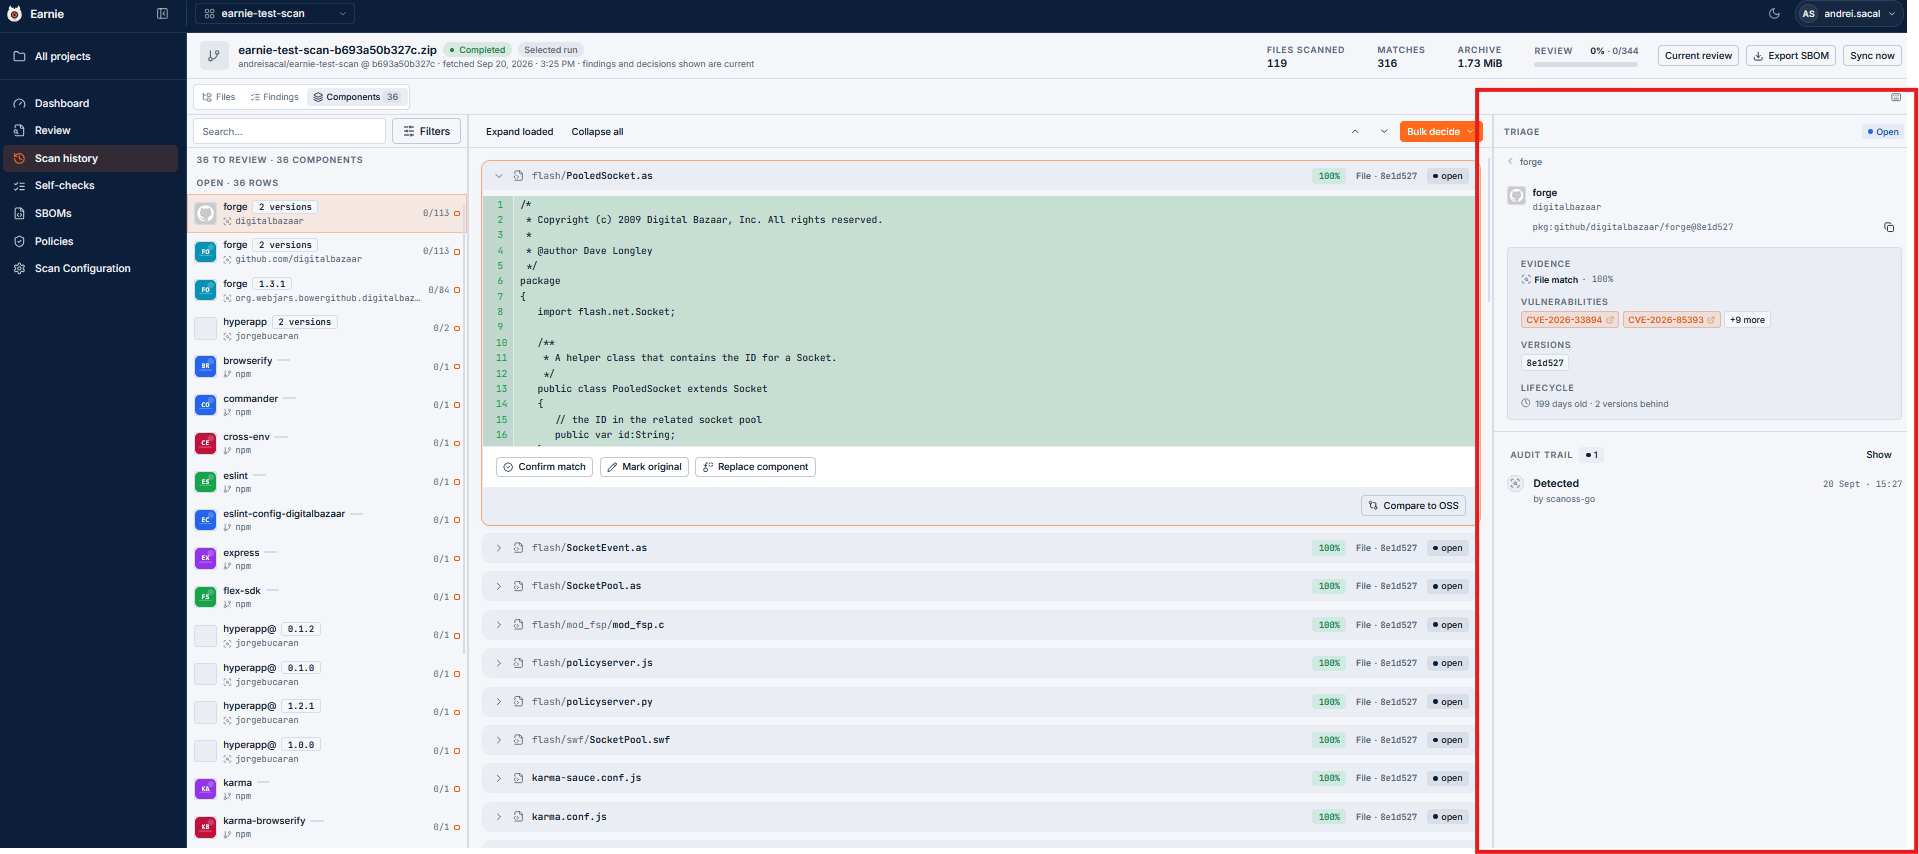
8. Taking Action on a Finding
From these findings, you can then take action. You can confirm the match, mark the code as original, or replace it with a different component — giving you a clear path from detection to decision.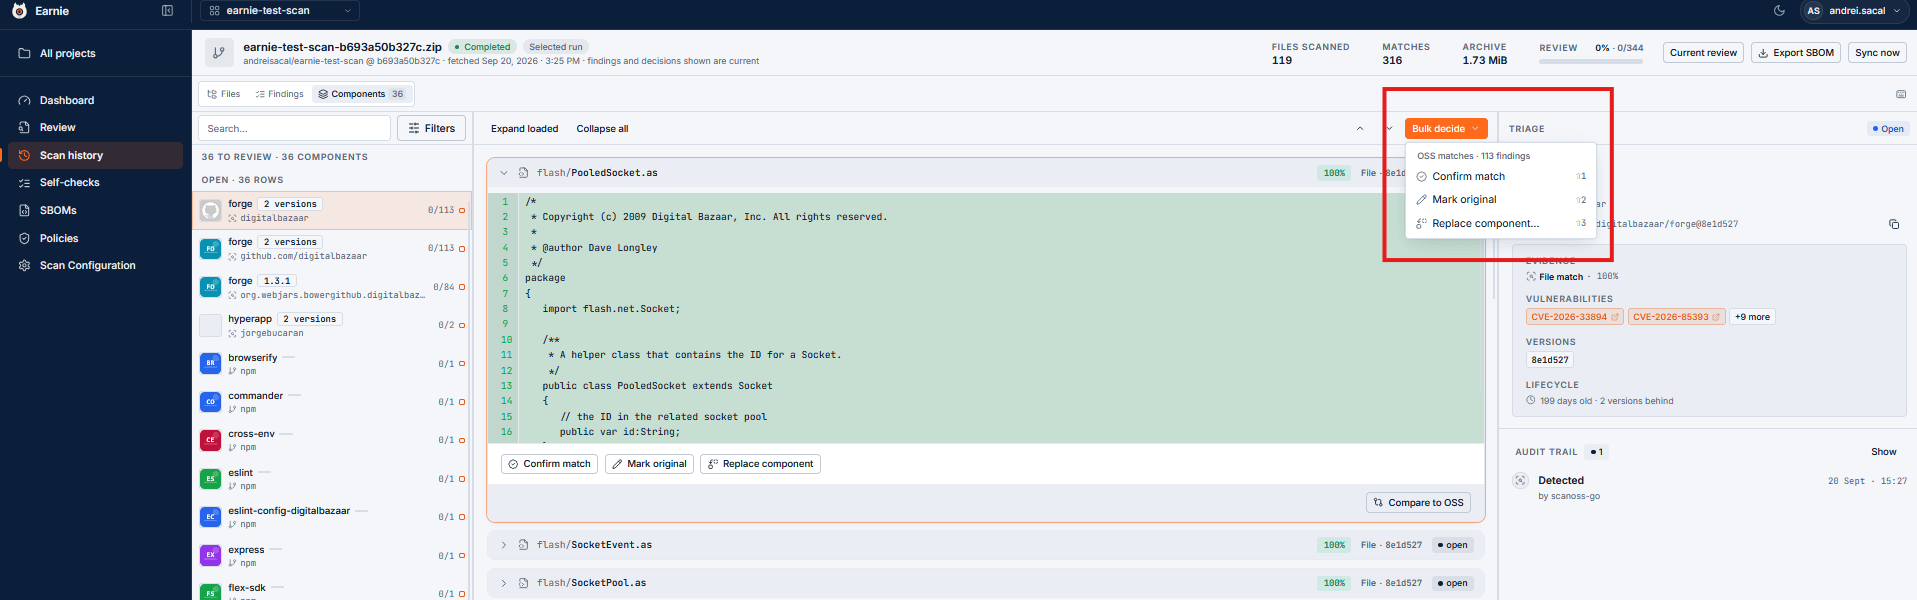
9. The Policy Page
Navigating to the Policy page, you can see all the policies currently active across your scanned projects. When creating a new policy, you have a few options. You can start with regulatory template sets, which provide predefined policies based on the requirements outlined in each framework. Alternatively, you can build a policy from scratch or customise one using the available templates.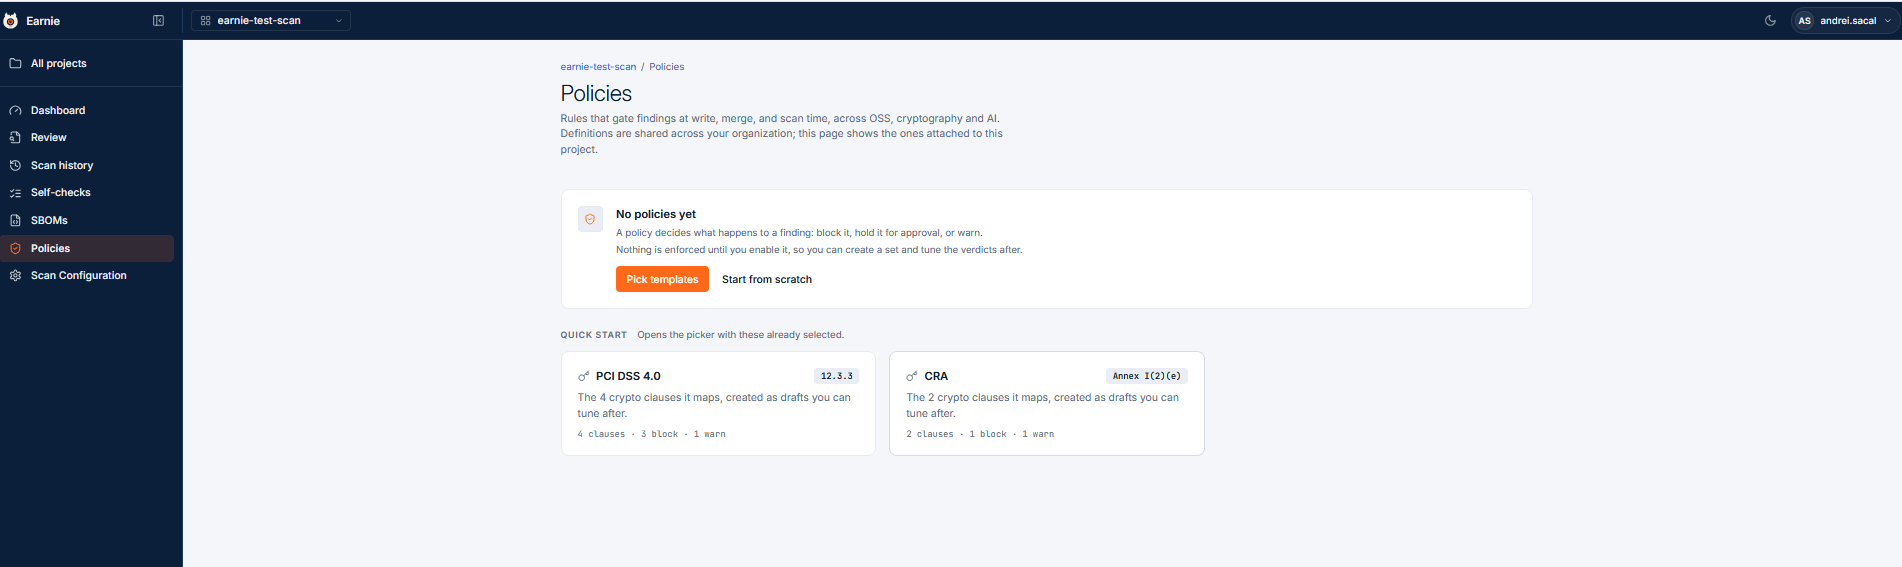
10. Inside a Policy
Clicking into a policy gives you a complete view of what’s happening. The Overview tab provides a summary, while the Violations tab shows which components are causing policy violations. From there, you can inspect the violation in more detail or request an approval, which can then be managed from the Approvals tab. Finally, the History tab gives you a full audit trail of events related to that policy.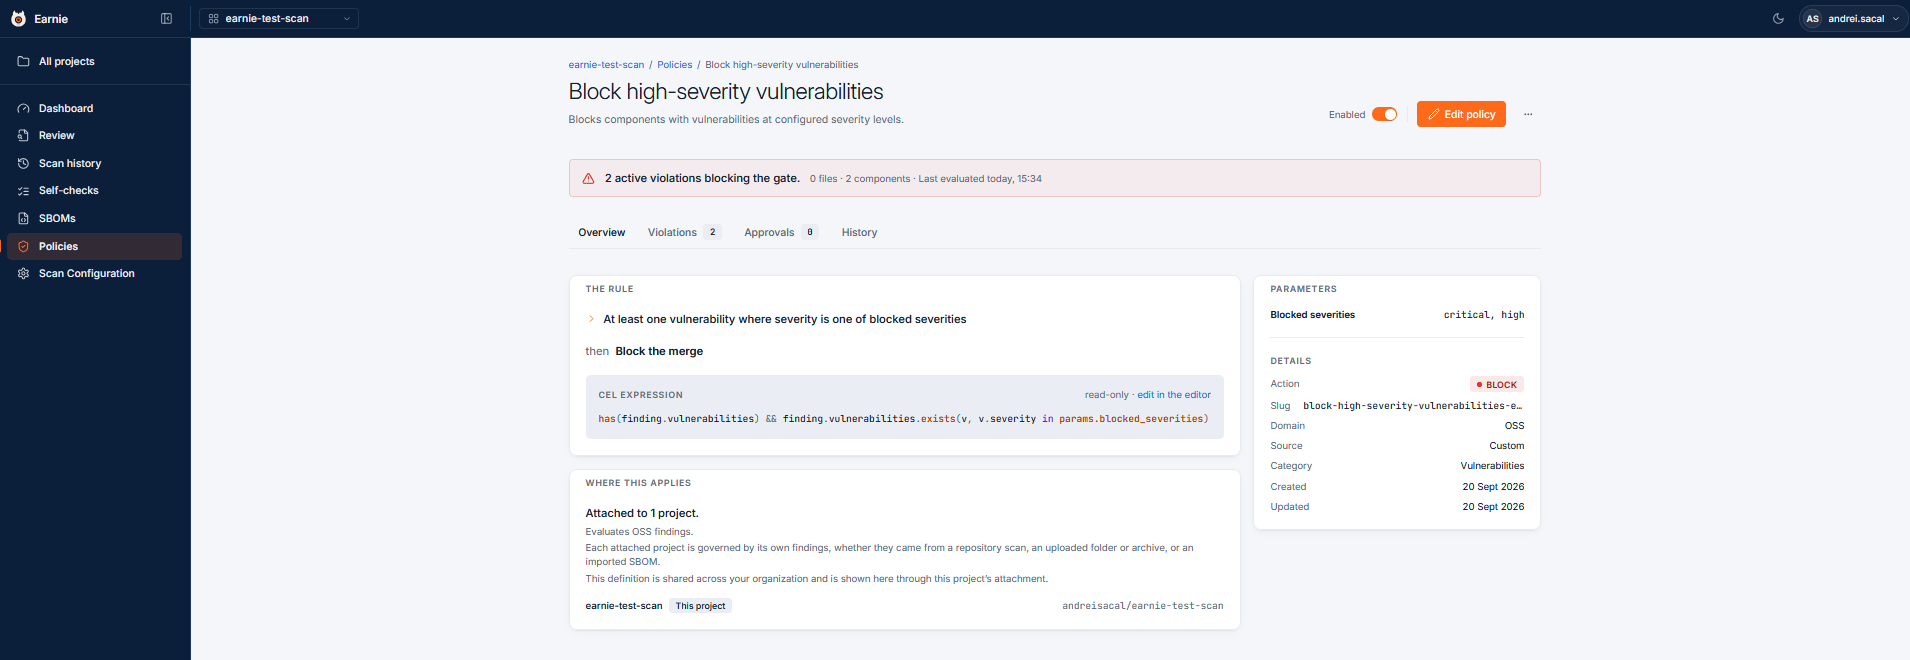
11. SBOM Snapshots
We call them SBOM snapshots because they capture the current state of your project at a specific point in time. As your project evolves, new findings will appear and different decisions may need to be made based on those findings. Each snapshot gives you a clear view of where your project stands at that point in time.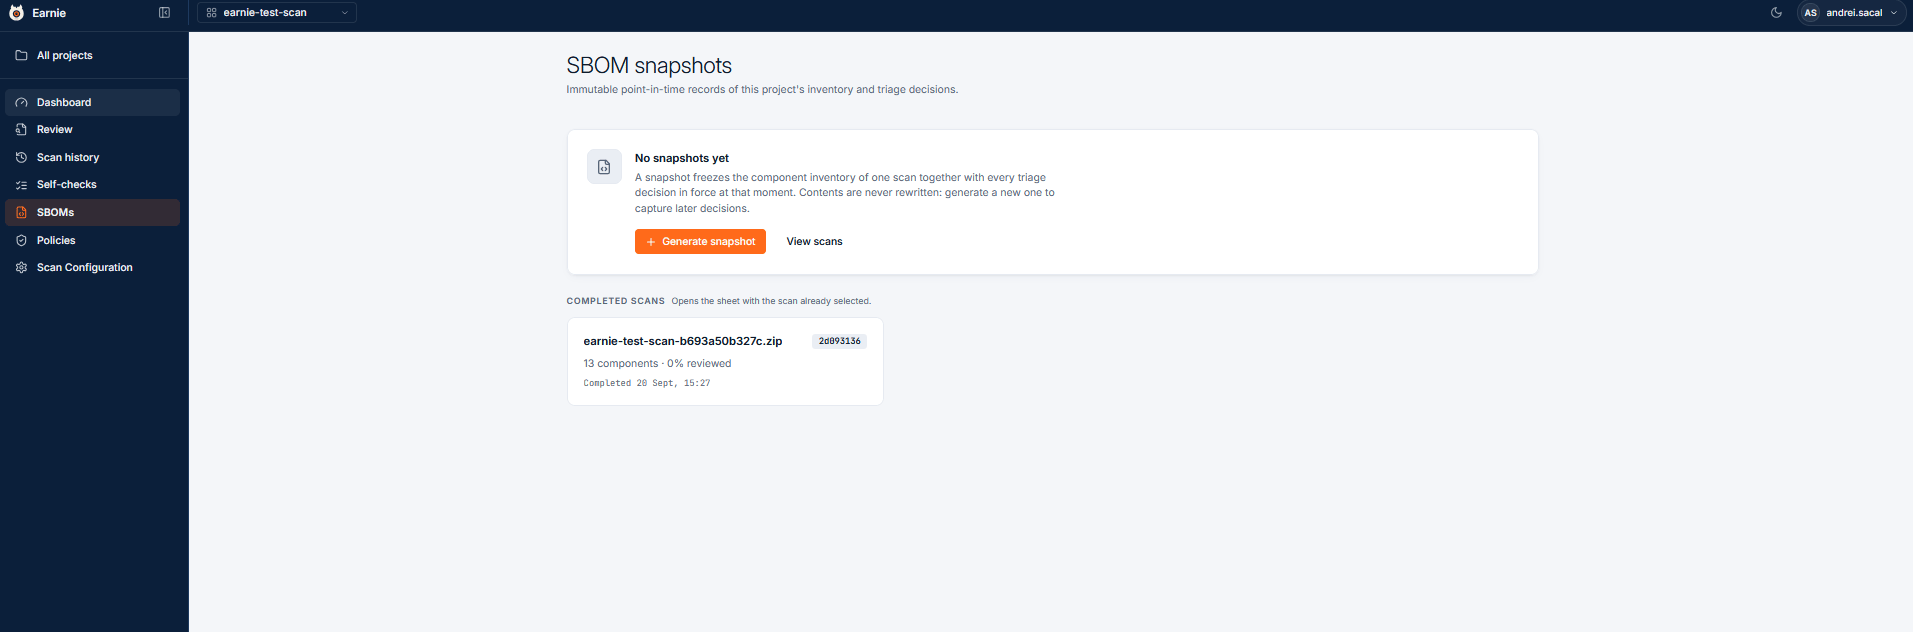
12. Connecting a Coding Agent via MCP
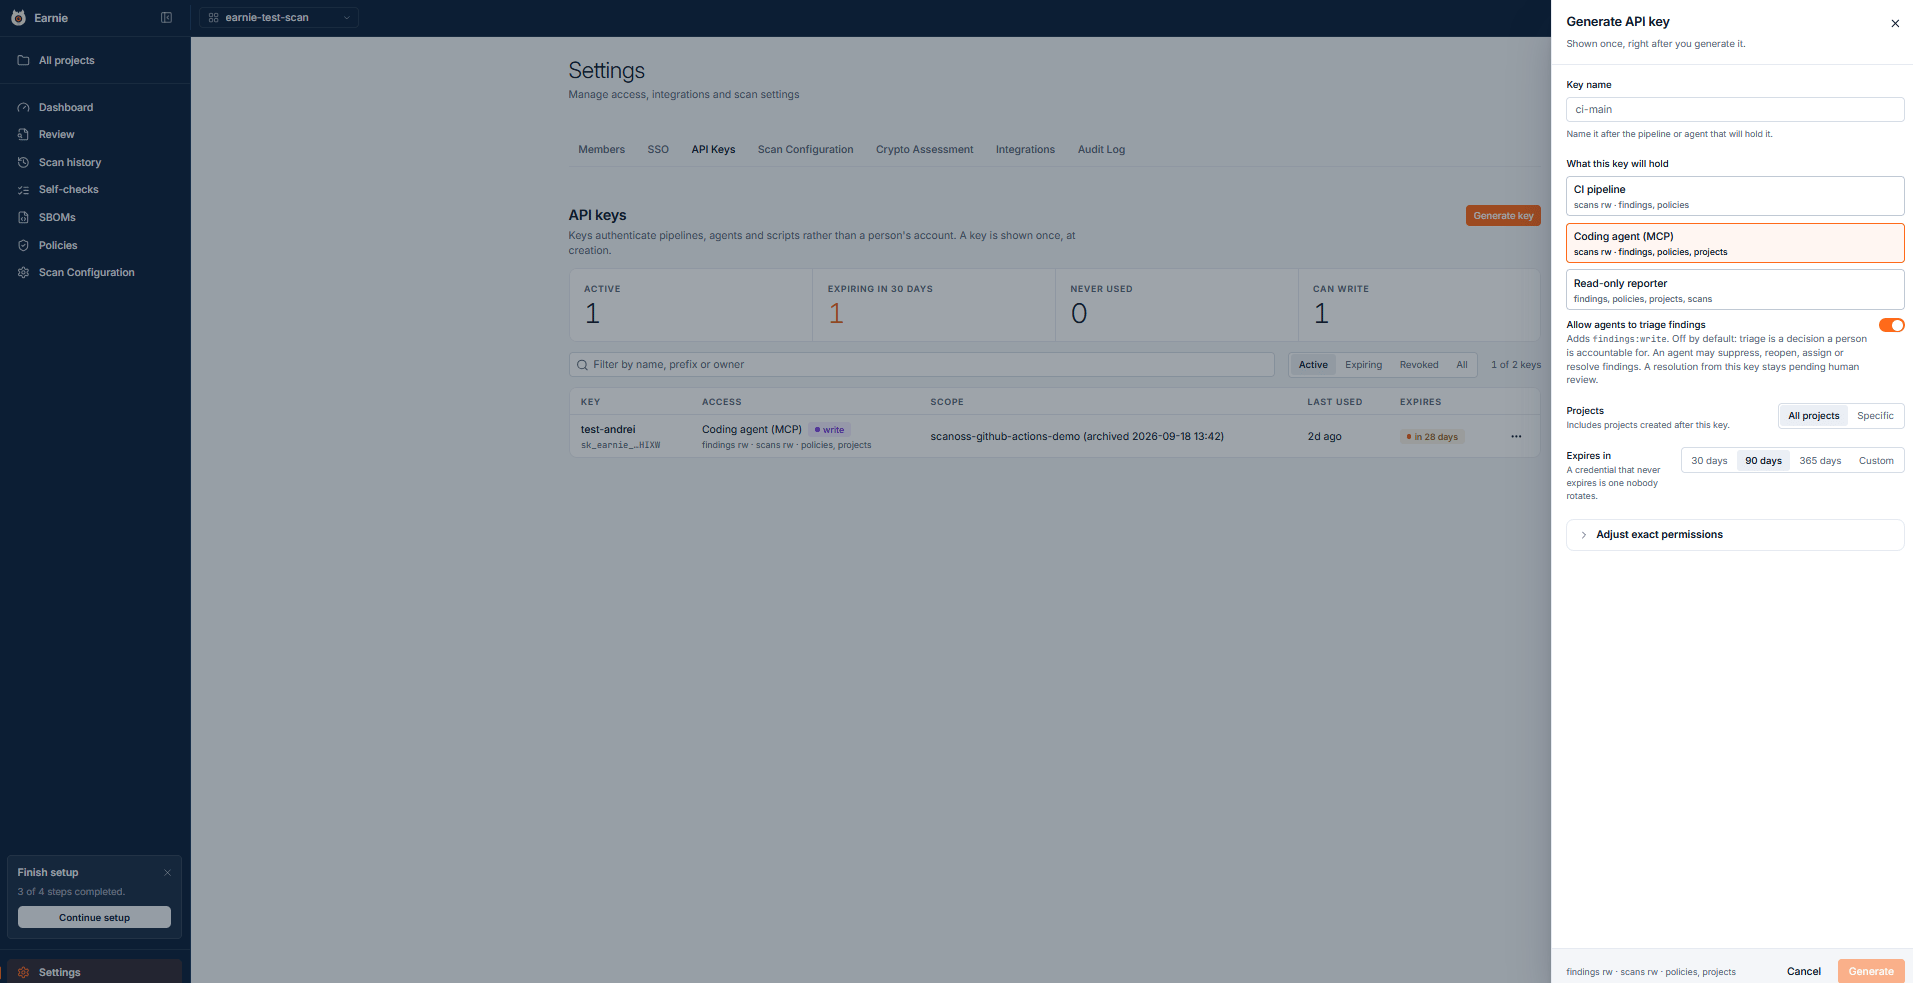
Under Settings, you can set up the MCP connection through the API Keys tab. Simply generate a key for your coding agent, copy the relevant command for the tool you’re using, and run it directly in your terminal.